Explore the Library
Ideate Software Resource Library
This is your one-stop-shop for all articles, client testimonials, news, events, brochures, and more. Enter text in the search bar to the right or use the dropdown menus to hone into the specific content you are interested in viewing.

TRAINING - VIDEO | Master even the most complex Revit export workflows with Ideate ExportHub, part of IdeateApps, and Ideate Automation.
TRAINING - VIDEO | Build powerful multi-format export packages with Ideate ExportHub, part of IdeateApps. Configure each export with custom sheet and view selections, naming rules, destination folders, and more.

TRAINING-VIDEO | Take control of your Revit exports with Ideate ExportHub, part of IdeateApps. Create fast, single-format exports with precise control over sheet and view selection, naming rules, destination folders, and more.

Discover what's new in Ideate Software 2027. This release introduces Ideate ExportHub, enhanced Ideate Automation workflows, dynamic sheet and view sets, improved cloud and Excel interoperability, and performance enhancements across the Ideate Software Bundle. Learn how these new features help Autodesk Revit users auto
NEWS - ARTICLE | Ideate Software has released a significant update to the Ideate Software Bundle and Ideate Automation, introducing centralized export capabilities, expanded model health workflows, and meaningful performance improvements for Revit teams.

TRAINING - VIDEO | Working in Autodesk Revit doesn’t have to mean dealing with cluttered models, hidden elements, or time-consuming manual tasks. In this video, we break down how Ideate Software helps AEC teams take back control of their Revit workflows through a powerful suite of tools.
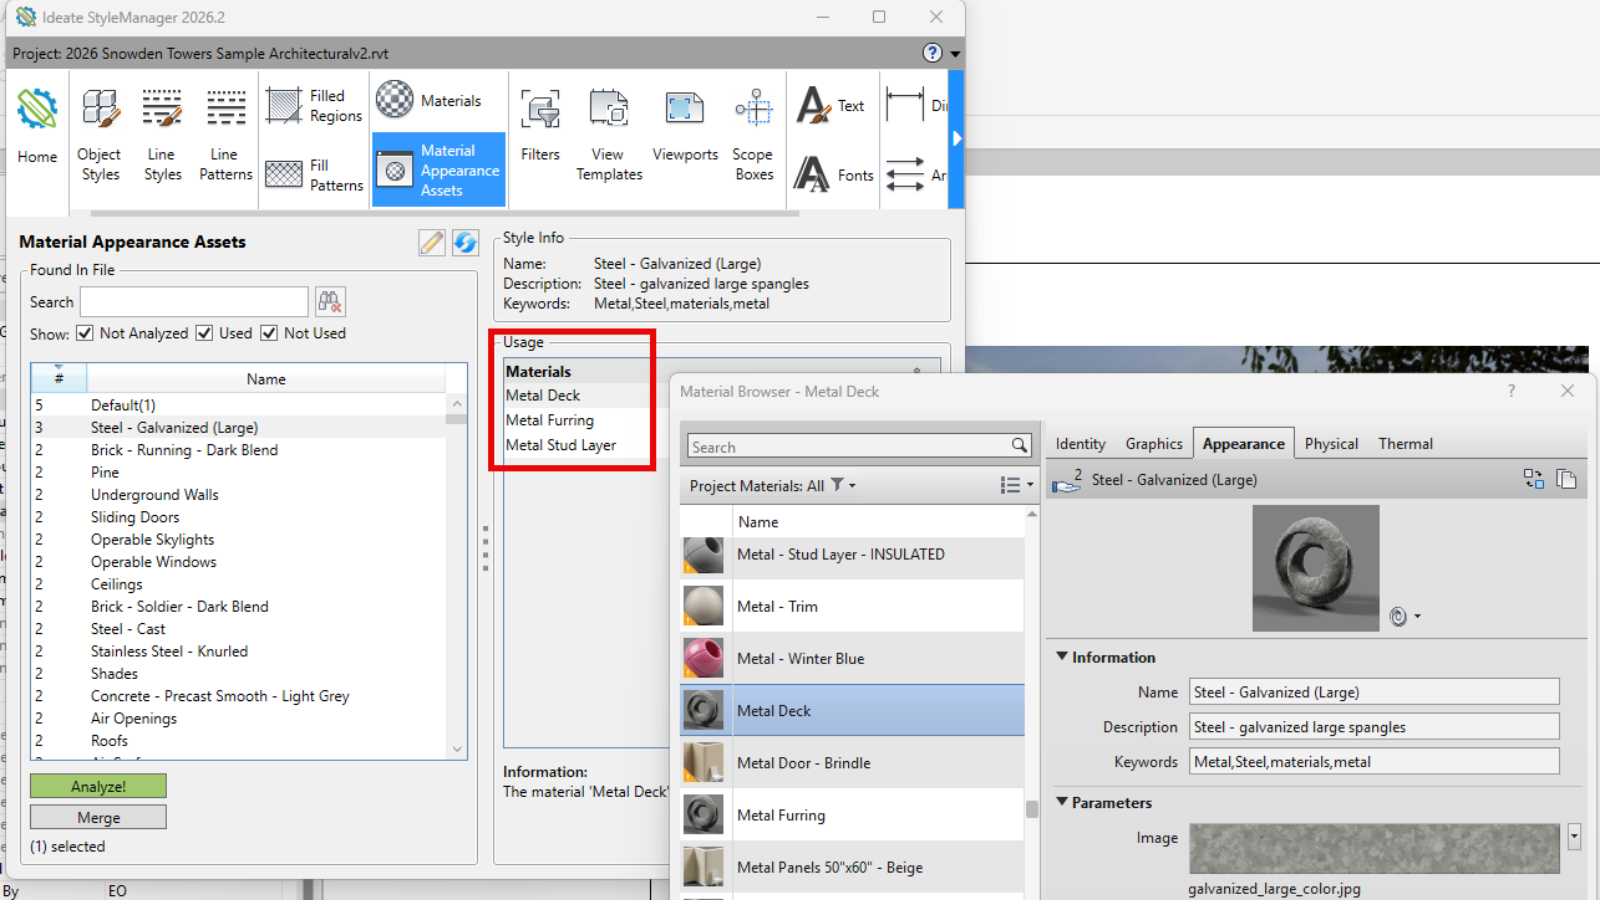
ARTICLE - TRAINING | Struggling with Revit material management? You’re not alone. Managing Revit material assets in the native Material Browser can lead to accidental edits, duplicated assets, and inconsistent data across projects. These challenges slow down workflows and make effective BIM material management harder t
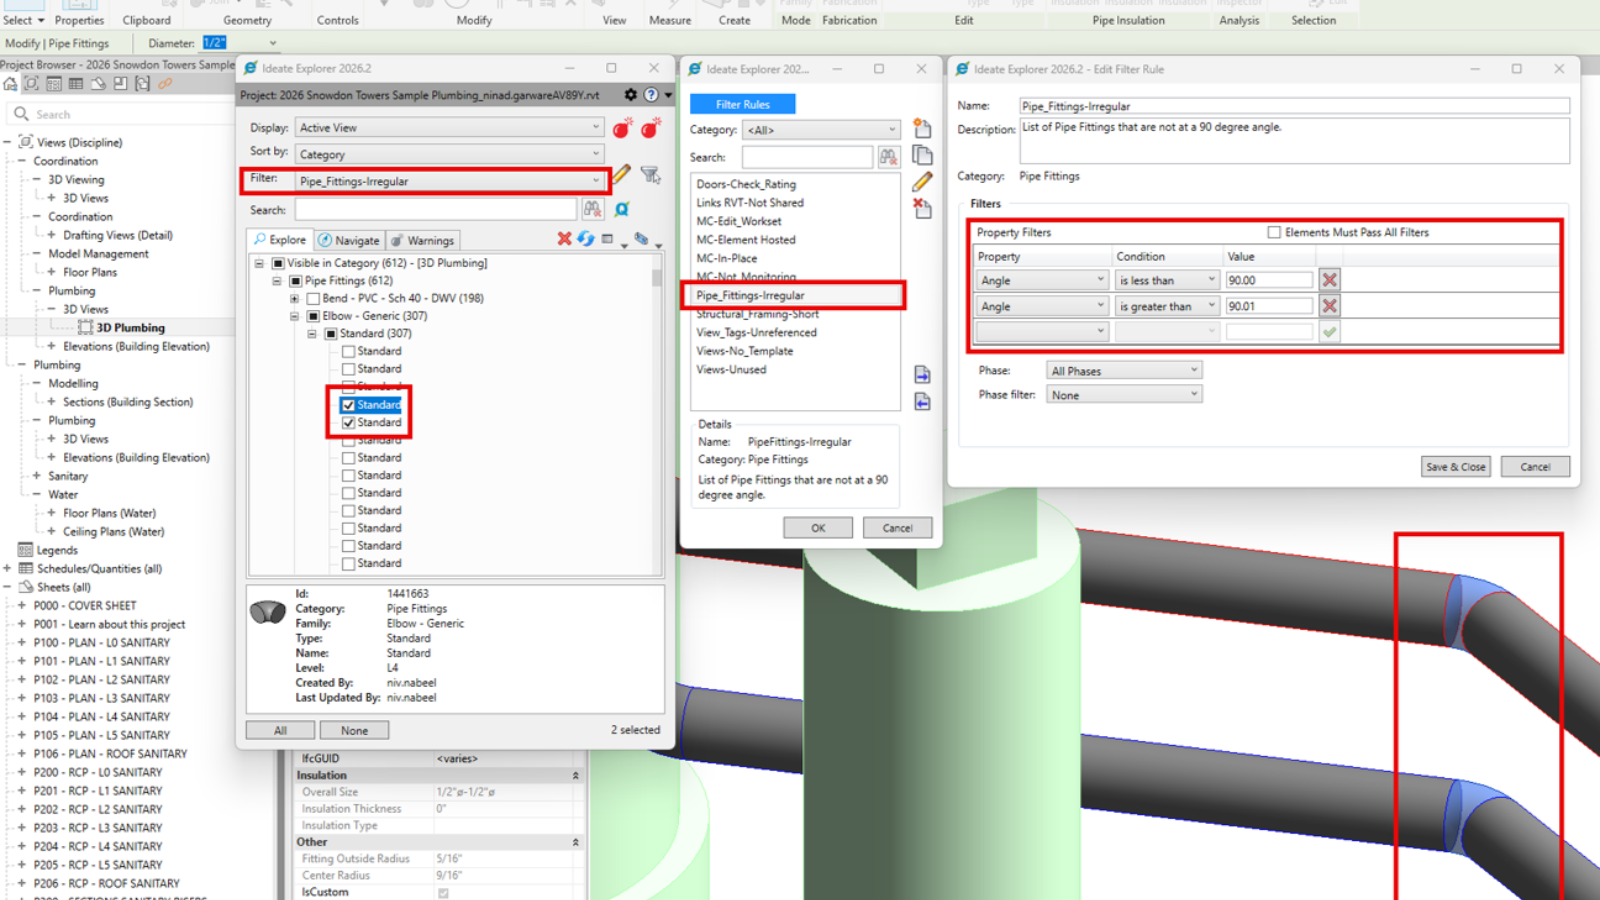
TRAINING - ARTICLE| Effectively managing MEP and Structural Revit models is critical for engineering teams handling complex projects. With thousands of elements like ducts, pipes, beams, sheets, and views, teams need to stay on top of edits, QA/QC, and standards compliance.
BROCHURE - PDF | Ideate Automation and File Sync work together to standardize, synchronize, and safeguard project data across your AECO ecosystem.
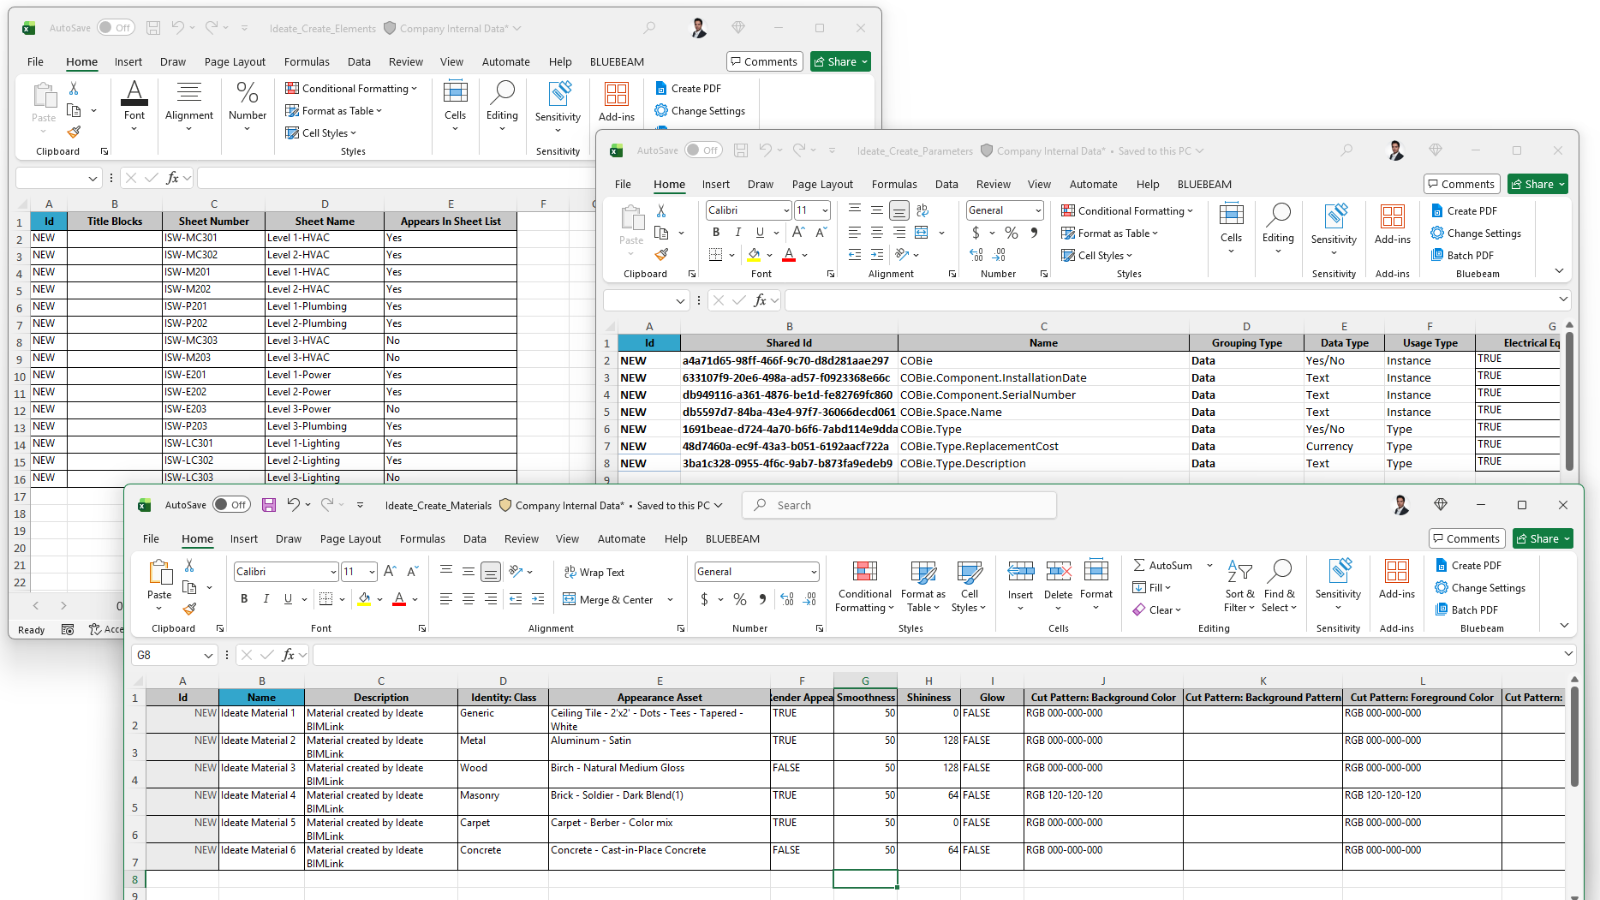
TRAINING - ARTICLE | Ideate Automation provides a purpose-built solution for Revit content creation automation, allowing teams to use Microsoft Excel to drive data directly into Revit models and families.

NEWS - ARTICLE | This January 4th, we pause to remember and celebrate our friend and colleague Richard Taylor—a kind and generous person, a passionate technologist, and someone whose curiosity and joy for discovery infused the spirit of Ideate Software.
TRAINING - ARTICLE | One specific area of digital transformation, regulatory shifts, or market demands is the Circular Economy - which aims to eliminate waste and keep materials in use for as long as possible.
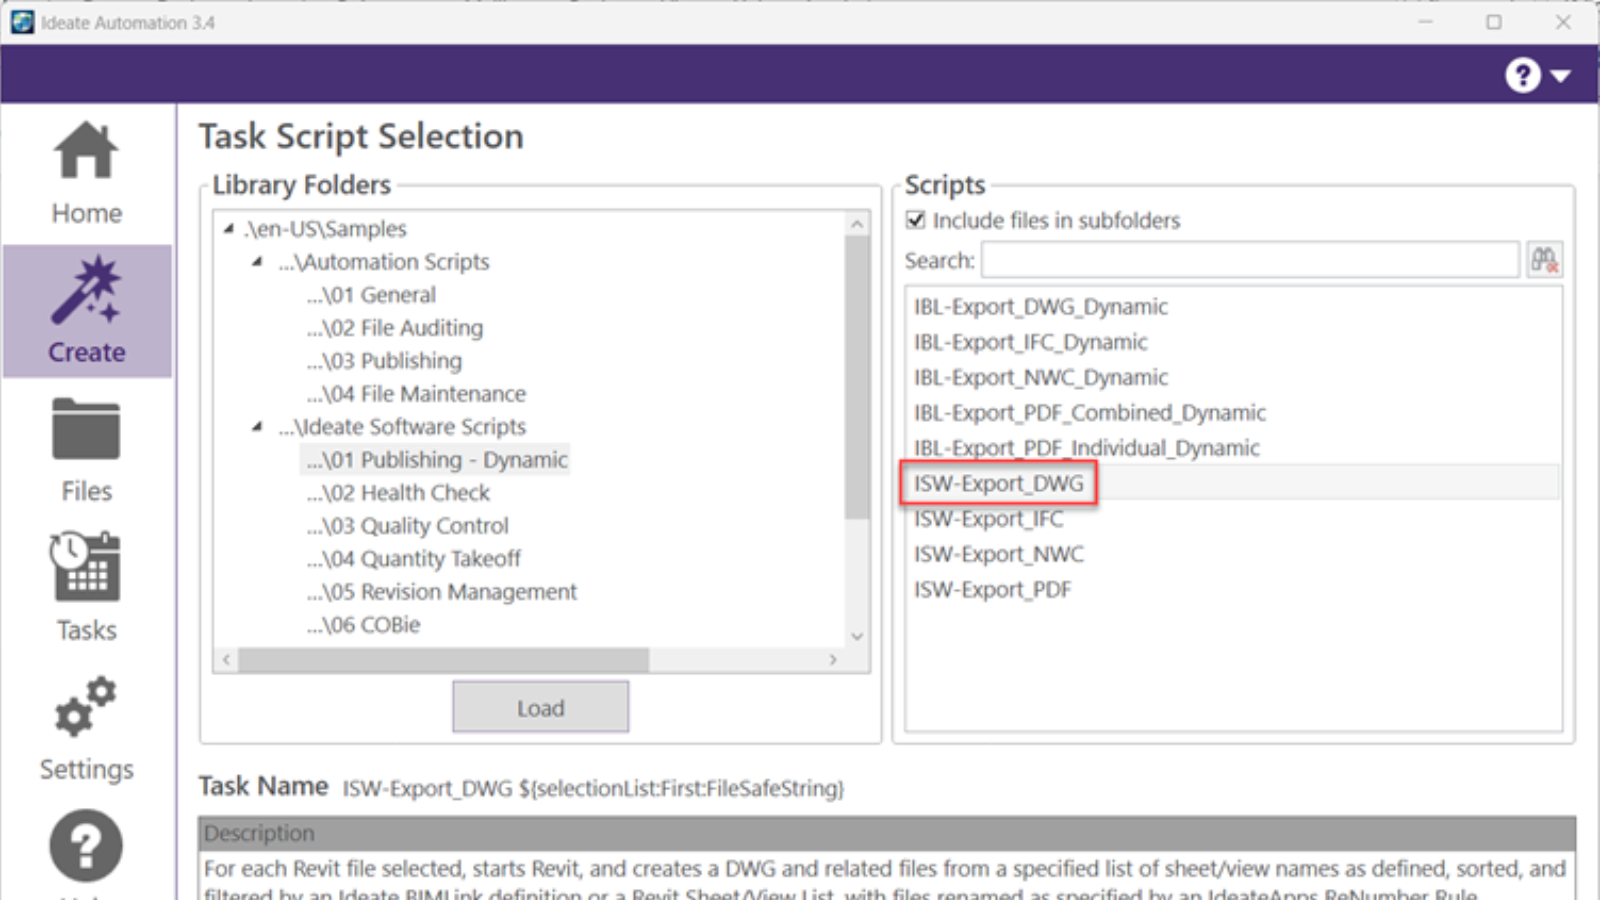
TRAINING - ARTICLE | Creating DWG exports from Revit models is still an important deliverable in most AEC projects. When exporting to DWG from Revit, there is no way to control the names of the resulting dwg exports. We are limited to the choice of Short (sheet number) or Long (Revit model name, sheet, etc.).
TRAINING - VIDEO | Easily create curtain wall elevations in Revit!
Creating curtain wall elevations doesn’t have to be time-consuming. With Ideate ViewCreator, you can quickly generate curtainwall elevations from 2D view or 3D elements customize view naming, apply view templates, avoid duplication, etc.
TRAINING - VIDEO | Generate material quantity takeoffs in Revit… automatically!
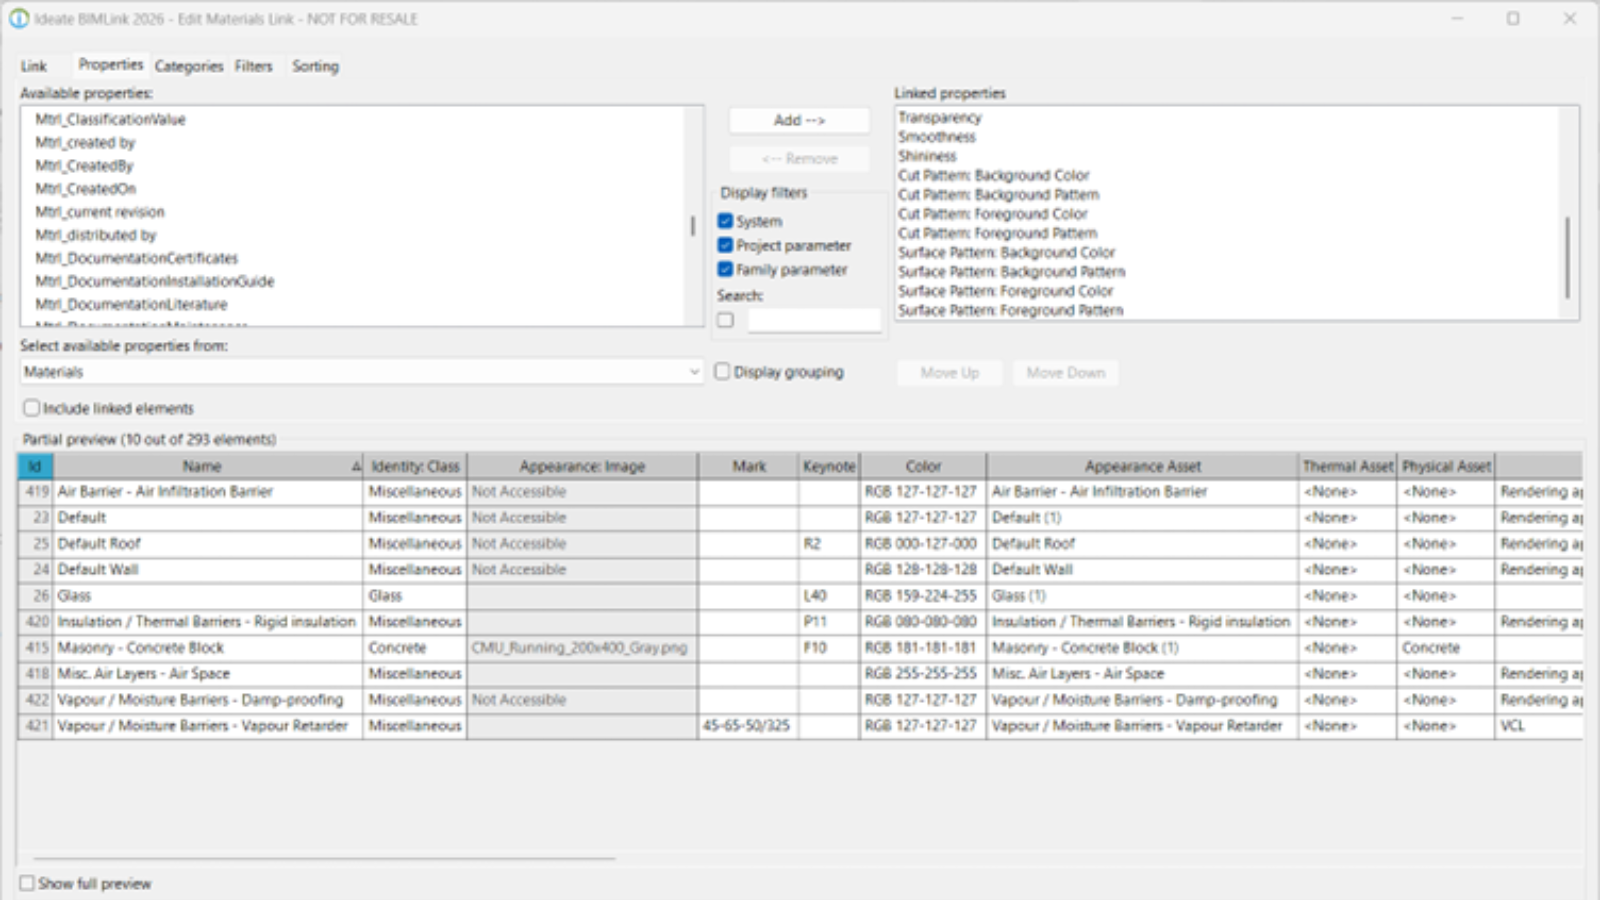
Say goodbye to manual material exports. With Ideate BIMLink’s new ‘Material_QTO link definition, you can quickly export material instance data, areas, and volumes directly from your Revit projects.

TRAINING - VIDEO | Edit and swap material assets in Revit with ease! Ideate BIMLink just got even better - now you can swap appearance, physical, and thermal material assets in your Revit projects.
TRAINING - VIDEO | Create new materials in Revit… fast! With Ideate BIMLink’s new definition called ‘Material-Create_NEW’, you can now create new materials or add an existing material directly into your Revit models.

NEWS - ARTICLE | Ideate Software, a leading developer of Revit productivity tools, is excited to reveal its refreshed logo, marking the next step in its journey as part of the Graitec Group. The new look blends the Ideate legacy of innovation with the global strength of Graitec.

CLIENT TESTIMONIAL - ARTICLE | ZGF Architects, a leading North American design firm focused on sustainable architecture, used Ideate Software for Revit to streamline workflows and meet strict UK BIM standards on two major Canadian hospital projects while managing over 1,300 sheets across 11 Revit models.

TRAINING - VIDEO | In this webinar recording, we’ll show you how to elevate your modeling and documentation workflows using Ideate Software. Learn how to keep your Revit files clean, eliminate model clutter, and streamline project management — all while saving serious time and reducing frustration.

